
Trade Plan Worksheet Tutorial
Each day prior to market open most members of our community creates a sheet comprised of 5 main sections which they work from directly during the trading session. One sheet from the founding members (typically NJ’s) is posted on the portion of the blog visible to the public each day. These sheets contain pretty much everything we need to know big picture wise to execute the plan for the day. This is “it” as they say – everything including directional biases, sentiment split by size, news reactions/anticipations, potential trade zone locations, major and interim support and resistance areas, etc. This is the EXACT sheet NJ uses when trading the ES in the intraday session. We also archive and study them in the same way we advocate you should and now have nearly seven years worth of historic plan sheets from the inception of DTG. This blog functions as our communication vehicle for this information amongst each other and we have just made a portion of it visible to the public. The community often compares them and uses them as a cornerstone for ongoing discussions.
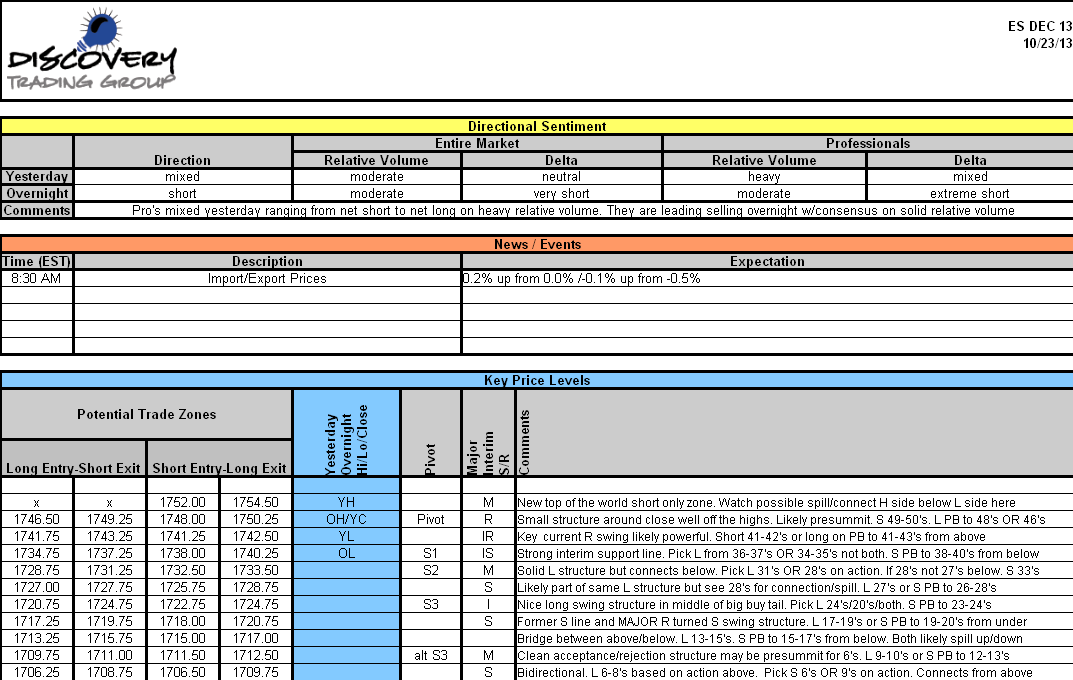
Though we have just recently made the catalogue of daily plan sheets and post trading journals public, it is already a vast resource which can be used by any trader to greatly enhance his or her skill – especially through utilization of market playback. If you are a Premium Member, you get to view this prior to the open every day. If not, you get access to the exact same information except it won’t be visible until after the close. Either way, you will find them in the main blog by date and titled “Trade Plan Worksheet”. We snap an image of the sheet and attach it to the post. To view full size, click the thumbnail. What follows is an example of what the sheet looks like all together with actual entries, along with an explanation of each section in detail.
The Comments:
-Before we break down the significance of each section it is important to point out what we feel may be the most important component of all sections – the comment fields. We find that physically writing or typing facts, ideas, instincts, gut feelings, etc. REALLY helps solidify the trading plan for the session. Furthermore, the simple act of knowing that others will read it forces you to consider what you write more carefully. Within each level there are often several areas of support or resistance and the comments gives us a place to clarify those prices we think the market will pay most attention to. It’s amazing how accurate those prices can be (thanks computerized trading). Here’s an example of prices pulled from a DTG Worksheet comments section and typed on a chart with the levels:

For more examples of how the comments shown on charts, see this post: http://wp.me/pRNeH-4hs
-Whether you pick up our daily plan at the end of the session, or you happen to get it pre-market as a member, you will notice that the important clues about which levels are more or less likely to connect or spill, where we will proceed with extra optimism or pessimism due to major or developing support/resistance, news or sentiment pressures interacting, etc. end up being what ultmately determine success or failure each day. Remember, trading is gambling and you are simply choosing one side of a binary proposition – like a coin flip. If you take out costs of trading you are left with a default even money proposition. What determines consistent success is your edge. Your edge comes from the way you interpret what occurs at each point of greatest contention between buyers and sellers along with the interaction of the risk and trade management models.
-The levels we are providing ARE where the most contention between buyers and sellers is likely to be. They come from actual trading and they don’t lie like indicators all trying to predict future behavior using time based analysis of the past. There is no time basis to our levels. Just how much traded at that price the last time the market was there. But this is also why we keep saying that the typical DTG members’ intraday trading methodology isn’t a system and you have to stop trying to turn everything into one. The methodology variants tend to “work” BECAUSE they aren’t rigid systems. Here is an example: Let’s say 1178 is an interim high and also the daily R1 and an acceptance and rejection area respectively on two previous days. Will this area be important? Of course. No-brainer. But will you short a move up to it, or look to trade a breakout above it? This is where our (or your) commentary comes in. What is going on in the world, news, correlated markets, volume, weather, holiday schedule, etc.? Your best guess as to how this all fits together is how you will hypothesize what you expect will happen and decide what you will do when price gets there. Then you will carefully watch order flow and if it confirms what you expect trade in your chosen direction. It is really quite elegant and simple. But you have to pick a side and have an opinion.
Sentiment Section:
-This section contains a few key items we use for handicapping reaction at key levels. Since our trading is very short term, we are only concerned with what was happening yesterday and what happened in the overnight/morning Globex section ahead of the open. In a nutshell we are looking for clues related to volume and whether that volume was net long or short. By further breaking it down by broad market and professional trader participation we can factor this information into a decision making process for the day.
-It is broken down by daily and overnight volume with an assessment of how MUCH volume in that direction there is relative to what is typical for the period. In addition, the delta analysis shows the differences that sometimes arise between the overall market direction and where the trading is. This is further broken down to show differences between the broad market and larger, typically institutional traders. The idea being that we can assess the overall commitment of traders which if significant will place upward or downward pressures on the market especially around key price levels.
-For example, if overnight volume was to the short side and the institutional order shorts represented 70% of their portion of the volume which was also twice the usual volume for the time period, that may signal that position traders are shifting down. If the daily volume over the last few days showed a similar pattern, this is even more powerful. Now imagine there was lots of short volume after a news announcement as well. When the cash market opens and the futures trade down to test the overnight low will you be extra cautious? Not fade it at all because down side pressure may be big enough to break the market down making that not a very high probability trade? You get the picture. There is never one answer, but it can be very helpful to analyze this stuff. Something to always remember about volume analysis: Volume is the truth. It is what really shows the market for what it is and no move is really important without it. It shows commitment of the participants, period. And just because bars are moving up or down doesn’t mean any volume is trading in them. Any trend with low volume is suspect and any range with high volume to one side is a potential leading indicator. Don’t think of bias as predicting net direction from open to close. Think of it as handicapping which key levels you think are most likely to hold or break relative to your risk and reward parameters of course. If the overnight low is a trade you are considering fading (going long when price falls into it), if you have a short bias you might want to consider passing on the trade or just scalping it as there are underlying downward pressures on the market. But if you had a long side bias, that means you think the lows are more likely to hold so you can feel better about trading back into the range for a bigger distance. Just an example of how you might conceptualize a thought process.
![]()
News Section:
-This is fairly self explanatory. Obviously we list any relevant economic news from 8:30, 9:15, 9:45, 9:55, & 10:00 which are the times of release potentially interacting with our first hour trading. If the news is pre-market we may list it and comment on the result. If it is after the open we may comment on what to expect or watch out for depending on what the number is. In this section we may also list and comment on any non-economic news, earnings, major world events, macro items at the forefront for the session. It is very important to know at least a little something about everything potentially effecting the market in a macro sense.
![]()
Key Market Structures Section:
-Each morning at some point prior to the cash market open we analyze all of the significant prior swing and volume structures above and below the current price. The goal is to look across a wide range of timeframes and identify areas likely to attract the attention of virtually all of the market participants with no regard as to whether we think they will be net buyers or net sellers when price revisits these structures. Relevant price ranges are broken down into a series of potential trade zones and displayed in a ladder fashion. As the session unfolds and price enters any of the zones, the idea is to start your analysis with a consideration of any biases, fundamentals, recent or expected news events, expected range for the day, gut feel, etc. to decide whether to consider trading long, short, or standing aside. If you have decided to stalk a trade entry at that point you would consider price action and/or orderflow in real time within the zone to time your entry.
-Each potential trade zone typically has separate long and short trade zones which often overlap. The idea is to identify key structures for trade entries or exits in either direction from any area. For example, if price is rising and enters a short entry zone from below, it would be a potential area to enter a countertrend trade or “fade” the move if bearish in the short run from that point. But if price is rising and passes through the long entry zone around that same area, a bullish trader would potentially look for a pullback into the long zone from above to enter a trend continuation trade.
-Long entry zones also double as potential exit areas for previously entered short trades above the current price. Similarly, short entry zones double as potential exit areas for previously entered long trades below the current price. For example, if price is approaching a structure significant enough to have a high probability of attracting a large number of new longs and/or considering a long trade from there yourself, it’s probably a good idea to scale out some or all of an existing short position prior to testing the back of that zone. Single lot traders may choose a single zone above or below their entry to scale all out into based on current conditions. Multiple lot traders may scale out a portion of their position into two or more zones above their entry coupled with managing their initial stop accordingly as well. Regardless, the zone structures allow for intuitive adjustment of targets and stops to the natural volatility changes which determine how close or far apart the major structures are each day.
-Some of the key structures each day may be especially strong or otherwise “important” to the market and are annotated as major or interim support or resistance areas. These metrics can be useful to handicap certain areas for relative strength or increased probability of holding the virgin test. In addition, the important individual levels of overnight high/low and yesterday high/low/close for the day are included. These can be of great interest especially when congruent with the key price structures for day.
-Regarding the included floor trader pivots, they are kind of a leftover of the now bygone era of the pits. Though now nothing more than just silly math calculations that have no real meaning in terms of traded volume, etc., they have an uncanny way of curve fitting themselves to price and price action so we still look at them. Lots of traders still look at them too and the market does tend to react to them. Of course when the market does react, nine times out of ten it will also be because there is a key swing or volume structure there also, but the pivot ends up being a bonus. If a price is a key rejection area and happens to be the daily R1/S1 or R2/S2 they tend to be even more powerful. Not as absolutes but it is nice to know when they “agree” with any key structures already identified for the session. Mostly though, we just use them as a guide to frame relative range of aggregate motion compared to the prior session. Are we opening into the center of yesterday’s range, or gapping into yesterday’s R3 range for example? Again, just a guide or icing on the cake.
-Again, pay special attention to the comments at each level. It is there that we point out important things we want to remember or stay away from getting sucked into, especially those related to increased probability of zones “spilling” over the anticipated edges and “connecting” to another zone just above or below which is very close. We can’t stress this enough. While zones above or below the current price may not change at all day to day in terms of the range of prices comprising the zone until tested for the first time, comments will likely change each session and may interpret things VERY differently day to day.
